

Tropical Storm Sonia’s Offshore Path Spares All Coastal Communities
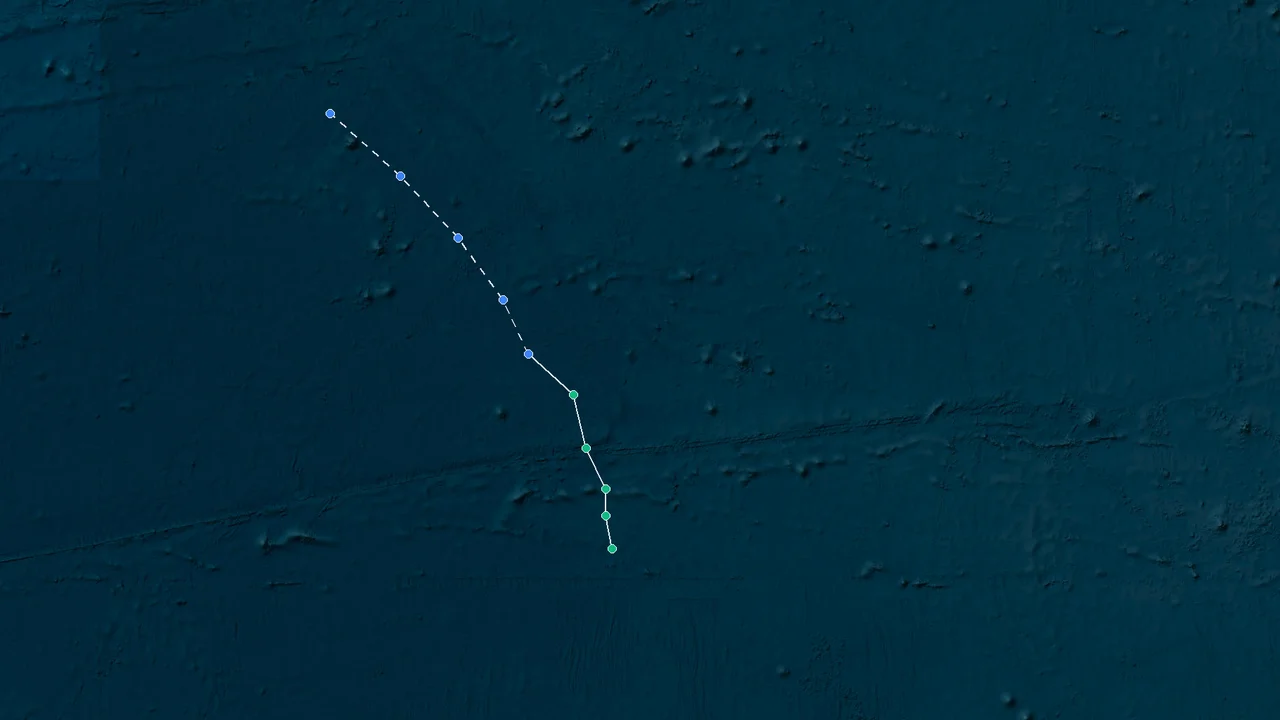
Tropical Storm Sonia formed in the eastern Pacific on 24 October 2025 and remained over open ocean throughout its lifecycle. The storm developed from a tropical wave and moved across central and western portions of the basin without affecting coastal regions. Sonia reached peak intensity with maximum sustained winds of 45 kt on 25 October 2025 while located well offshore. The system weakened under unfavorable atmospheric conditions, becoming post-tropical on 29 October after its tropical cyclone phase ended on 28 October.
Sonia Forms Far Offshore — Satellite Eyes Its Brief Intensification
Tropical Storm Sonia originated from a tropical wave that crossed Central America on 16–17 October 2025 before entering the eastern Pacific basin. The disturbance moved westward at approximately 10 kt over the following days while producing disorganized showers and thunderstorms. A surface trough became increasingly defined in scatterometer observations during 22–23 October, while convection gradually organized around a developing low-level circulation.
The National Hurricane Center (NHC) classified Sonia as a tropical depression at 0600 UTC on 24 October, when the system was located about 615 nautical miles south-southwest of the southern tip of the Baja California peninsula. Satellite imagery, microwave observations, and objective intensity estimates supported the formation analysis as the circulation became better established over open waters.
Sonia’s formation followed the general characteristics of a late-season eastern Pacific system. The cyclone developed far from major land areas, allowing meteorologists to rely primarily on remote sensing data rather than surface observations. The storm’s track remained westward, keeping it away from coastal zones and populated areas across the western Pacific and East Asia.
Although the Philippines is frequently affected by western Pacific tropical cyclones, Sonia did not enter the Philippine Area of Responsibility (PAR). As a result, the Philippine Atmospheric, Geophysical and Astronomical Services Administration (PAGASA) did not assign a local Bagyong name to the system and did not issue Tropical Cyclone Wind Signals, which range from Signal No. 1 to Signal No. 5 for storms affecting the Philippines.
The early monitoring of Sonia demonstrated the importance of satellite-based analysis for remote tropical systems. With no direct land interaction, the storm’s development record was constructed from infrared satellite imagery, microwave data, scatterometer measurements, and Dvorak technique assessments used by operational forecasting agencies.
Peak Winds Hit 45 kt — But Shear Quickly Unravels the Storm
Sonia strengthened from a tropical depression into a tropical storm during 25 October 2025. At 0000 UTC, the cyclone reached tropical storm status with estimated winds of 35 kt and a central pressure of approximately 1005 mb. The storm continued to organize during the day as convection became more concentrated near the center of circulation.
The cyclone reached its maximum intensity from 1200 UTC on 25 October to 1200 UTC on 26 October. NHC estimated peak winds of 45 kt, supported by TAFB (Tropical Analysis and Forecast Branch) and SAB (Satellite Analysis Branch) Dvorak classifications, along with satellite-based intensity tools including UW-CIMSS SATCON, AiDT, and D-MINT estimates. A 0548 UTC 26 October ASCAT-C pass observed winds consistent with the operational intensity estimate after accounting for sampling limitations.
Sonia remained a tropical storm rather than reaching hurricane strength. Its strongest phase was brief, and the storm later experienced declining organization as environmental conditions became less supportive. Increasing wind shear displaced convection away from the center and weakened the cyclone’s internal structure.
Operational forecasts during Sonia’s mature stage highlighted the difficulty of predicting organization under evolving shear conditions. Satellite imagery showed changes in the storm’s convective pattern, while analysts tracked the separation between the low-level circulation and remaining thunderstorm activity.
The cyclone’s offshore position prevented impacts across populated coastal regions. No coastal watches or warnings were issued, and no reports of damage or fatalities were associated with Sonia. The storm remained a remote Pacific system monitored through satellite observations and operational analysis.
Post-Tropical by 29 October — Remnant Low Fades Over Empty Pacific
After reaching peak intensity, Sonia gradually weakened as it moved westward over the eastern Pacific. By 27 October, satellite imagery showed reduced convective organization, with thunderstorms becoming less persistent around the center. The storm continued to maintain tropical storm intensity for part of 28 October before entering its final weakening stage.
On 28 October, Sonia weakened as atmospheric conditions limited its ability to sustain deep convection. The cyclone remained over open waters, with no interaction with coastal environments or populated areas. The storm’s circulation continued moving westward while losing tropical characteristics.
At 1800 UTC on 28 October, Sonia weakened into a tropical depression, with maximum winds decreasing to 25 kt and the central pressure rising to approximately 1009 mb. The system transitioned into a post-tropical remnant low on 29 October as its remaining circulation moved farther across the Pacific.
The final phase of Sonia’s lifecycle produced no recorded coastal impacts. Unlike storms that enter warning zones requiring regional preparations, Sonia remained outside areas where coastal disaster agencies needed to issue storm alerts or coordinate emergency measures.
The storm’s track ended as a remote Pacific weather event documented through satellite observations. Its tropical cyclone phase lasted from 24–28 October 2025, followed by post-tropical weakening over open ocean waters.
No Land, No Damage — Sonia’s Legacy Is a Satellite Case Study
Tropical Storm Sonia provided a clear example of modern tropical cyclone monitoring when a storm remains distant from populated regions. The absence of land observations meant that satellite platforms supplied the primary evidence for analyzing its formation, intensification, weakening, and transition.
NHC’s best-track analysis recorded Sonia’s peak intensity at 45 kt with a minimum central pressure of 1001 mb on 25 October 2025. The cyclone maintained tropical storm status for several days but never reached hurricane intensity during its existence.
Its maximum wind speed of 45 kt and minimum central pressure near 1001 mb kept Sonia below hurricane intensity throughout its lifecycle. The storm’s evolution was controlled by its offshore environment, changing atmospheric structure, and the gradual loss of organized convection.
Sonia also demonstrated the difference between cyclone intensity and societal impact. While the storm met the classification criteria for a tropical storm, its distant Pacific track prevented exposure to coastal populations and infrastructure. No damage reports, fatalities, evacuations, or emergency responses were linked to the system.
The final meteorological record places Sonia among the 2025 eastern Pacific tropical cyclones monitored through satellite technology. Its circulation weakened after transitioning beyond the tropical cyclone stage, leaving a documented track from formation on 24 October to the dissipation of its remaining circulation on 29 October 2025 over the open Pacific.